We explore here the distribution of A, T, G or C mutated among the mutated molecules sequenced in a DGRec experiment.
We start from a list of genotypes and the number molecules found for each:
Code
from dgrec.utils import parse_genotypes, str_to_mutfrom dgrec.example_data import get_example_data_dirfrom Bio import SeqIOimport osimport numpy as npimport matplotlib.pyplot as plt#Importing a list of genotypes with the number of molecules detected for each genotypedata_path=get_example_data_dir()gen_list=parse_genotypes(os.path.join(data_path,"sacB_genotypes.csv"))gen_list[0:50:5]
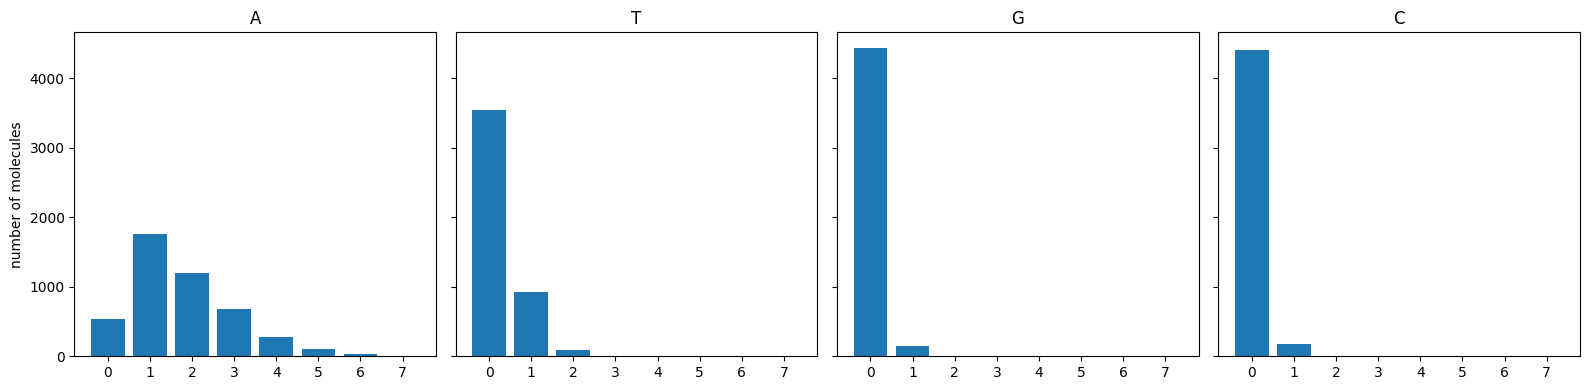
We then plot how many of each base is found mutated among mutated molecules
Code
#converting genotype strings to listsmutations=[[str_to_mut(gen[0]),gen[1]] for gen in gen_list[1:]] #Counting the number genotypes with c bases mutated for each possible basebases="ATGC"nN_mut=dict([(b,np.zeros(8)) for b in bases])for g,n in mutations: mutated_bases=np.array(list(zip(*g))[0])for b in bases: c=np.sum(mutated_bases==b) #number of mutated bases that are adenines nN_mut[b][c]+=nfig, axes = plt.subplots(1,4,figsize=(16,4), sharey=True)axes[0].set_ylabel("number of molecules")for i,b inenumerate(bases): axes[i].bar(range(8),nN_mut[b]) axes[i].set_title(b) axes[i].set_xticks(range(8))# Adjust layoutplt.tight_layout()plt.show()